
在 pytorch 中使用鱼眼图像增强数据

引言
近年来,深度学习在各个方面取得了巨大的成就,但是深度学习模型非常依赖数据,并且需要大量标签数据进行训练。除了手动标记更多的数据,还可以使用数据增强来自动为模型生成新的标记数据,并扩展现有的训练数据集。一些流行的图像数据增强是翻转、裁剪、旋转、缩放、剪切、颜色通道失真、模糊等。在本文中,我们将介绍两种在深度学习中不太流行,但对扩展数据集非常有用的数据增强方法。
旋转、剪切、缩放等增量变换都是对图像进行线性变换的仿射变换。与线性变换相比,我在这篇文章中介绍的以下两个变换是非线性的。
- 鱼眼变换
- 水平波变换
鱼眼变换
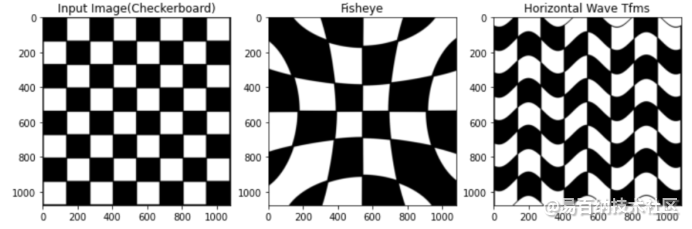
鱼眼变换是一种非线性变换,对于给定的中心像素,基于与给定中心像素的距离,使图像中的像素发生畸变。实际上,靠近中心的像素比远离中心的像素受到的失真要少得多。鱼眼变换采用中心和畸变因子两个参数。中心定义了转换的中心,畸变因子控制用于转换的畸变量。
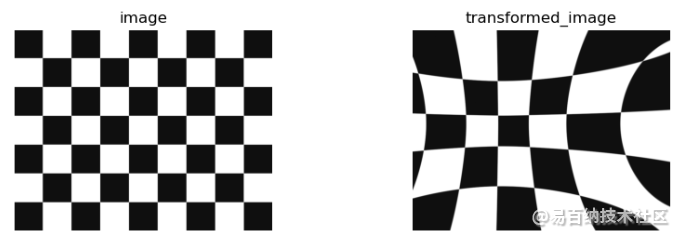
上图显示了鱼眼变换对棋盘图像的影响,中心聚焦在图像的中点附近。
数学上,给定像素(x,y)的鱼眼变换函数由以下公式给出。
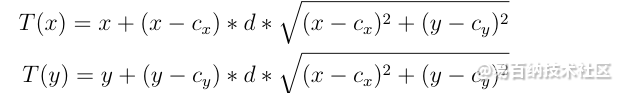
其中  <c_x,c_y> 代表转换的中心,“d”代表失真因子。<t(x),t(y)> 是像素 <x,y> 的转换值
请注意,对于所有的输入图像像素位置都被标准化为一个网格,左上角的像素代表位置 <-1,-1> ,右下角的像素代表位置 <1,1> 。<0,0> 表示图像的精确中心像素。所以 x 轴和 y 轴的范围是从 -1到1。对于上面的图像,失真因子(d)设置为0.25,中心是随机采样的间隔[-0.5,0.5]。
水平波变换
水平波变换是另一种非线性变换,它使像素变形为给定幅度和频率的水平余弦波形状。它需要两个参数,振幅和频率。
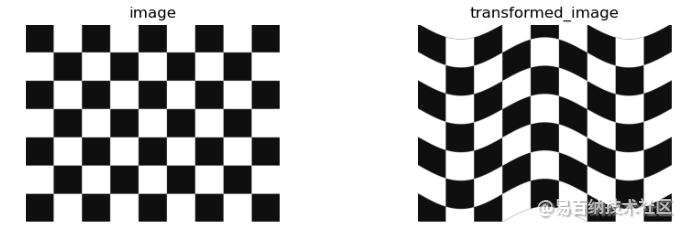
上图显示了水平波变换对棋盘图像的影响。
在数学上,给定像素(x,y)的水平波变换函数由下面的公式给出。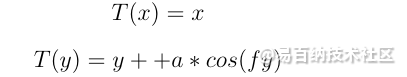
其中“a”是给定的余弦波振幅,“f”是预先指定的频率。<t(x) ,t(y)> 是像素 <x,y> 的变换值。注意,水平波不会对像素的 x 坐标产生任何失真。与鱼眼转换示例类似,x 和 y 的范围是从 -1到1。在上面的例子中,“a”的值是0.2,“f”的值是20。
实例
在本节中,我将介绍 PyTorch 中两种转换的矢量化实现。我更喜欢矢量化,因为它比耗时的 for 循环计算转换的速度要快得多。让我们先从鱼眼变换开始。
def get_of_fisheye(H, W, center, magnitude):
  xx, yy = torch.linspace(-1, 1, W), torch.linspace(-1, 1, H)
  gridy, gridx  = torch.meshgrid(yy, xx). //create identity grid
  grid = torch.stack([gridx, gridy], dim=-1)
  d = center - grid      //calculate the distance(cx - x, cy - y)
  d_sum = torch.sqrt((d**2).sum(axis=-1)) //sqrt((cx-x)^2+(cy-y)^2)
  grid += d * d_sum.unsqueeze(-1) * magnitude
  return grid.unsqueeze(0)
fisheye_grid = get_of_fisheye(H, W, torch.tensor([0,0]), 0.4)
fisheye_output = F.grid_sample(imgs, fisheye_grid)
上面的代码通过以下 4 个步骤来转换图像。
1.创建一个(H, W, 2 )大小的标识网格,其中 x 和 y 的范围从-1 到 1。
2.计算网格中每个像素到给定中心像素的距离
3.计算每个像素与中心像素的欧几里德距离。
4.计算 dist d 幅度并添加到原始网格。
5.使用 PyTorch 的 grid _ sample 函数对图像进行变换。
类似地,下面的代码使用水平波变换转换图像。
def get_of_horizontalwave(H, W, center, magnitude):
  xx, yy = torch.linspace(-1, 1, W), torch.linspace(-1, 1, H)
  gridy, gridx  = torch.meshgrid(yy, xx). //create identity grid
  grid = torch.stack([gridx, gridy], dim=-1)
  dy = amplitude * torch.cos(freq * grid[:,:,0]) //calculate dy
  grid[:,:,1] += dy
  return grid.unsqueeze(0)
hwave_grid = get_of_horizontalwave(H, W, 10, 0.1)
hwave_output = F.grid_sample(imgs, hwave_grid)
下面是所有的代码,并对棋盘图像进行了处理。
import numpy as np
import matplotlib.pyplot as plt
from PIL import Image

import torch
import torch.nn.functional as F
import torchvision.transforms as transforms

## Fisheye Transformation
def get_of_fisheye(height, width, center, magnitude):
  xx, yy = torch.linspace(-1, 1, width), torch.linspace(-1, 1, height)
  gridy, gridx  = torch.meshgrid(yy, xx)   #create identity grid
  grid = torch.stack([gridx, gridy], dim=-1)
  d = center - grid         #calculate the distance(cx - x, cy - y)
  d_sum = torch.sqrt((d**2).sum(axis=-1)) # sqrt((cx-x)**2 + (cy-y)**2)
  grid += d * d_sum.unsqueeze(-1) * magnitude #calculate dx & dy and add to original values
  return grid.unsqueeze(0)    #unsqueeze(0) since the grid needs to be 4D.

## Horizontal Wave Transformation
def get_of_horizontalwave(height, width, freq, amplitude):
  xx, yy = torch.linspace(-1, 1, width), torch.linspace(-1, 1, height)
  gridy, gridx = torch.meshgrid(yy, xx) #create identity grid
  grid = torch.stack([gridx, gridy], dim=-1)
  dy = amplitude * torch.cos(freq * grid[:,:,0]) #calculate dy
  grid[:,:,1] += dy
  return grid.unsqueeze(0)  #unsqueeze(0) since the grid needs to be 4D.

## UTILITY FUNCTIONS
## Create Image Batch
def get_image_batch(img):
  transform = transforms.Compose([transforms.ToTensor()])
  tfms_img = transform(img)
  imgs = torch.unsqueeze(tfms_img, dim=0)
  return imgs

def plot(img, fisheye_output, hwave_output):
  fisheye_out = fisheye_output[0].numpy()
  fisheye_out = np.moveaxis(fisheye_out, 0,-1)

  hwave_out = hwave_output[0].numpy()
  hwave_out = np.moveaxis(hwave_out, 0,-1)

  fig, ax = plt.subplots(1,3, figsize=(16,4))
  ax[0].imshow(img)
  ax[1].imshow(fisheye_out)
  ax[2].imshow(hwave_out)

  ax[0].set_title('Input Image(Checkerboard)')
  ax[1].set_title('Fisheye')
  ax[2].set_title('Horizontal Wave Tfms')
  plt.show()

img = Image.open('checkerboard.png')
imgs = get_image_batch(img)
N, C, H, W = imgs.shape
fisheye_grid = get_of_fisheye(H, W, torch.tensor([0,0]), 0.4)
hwave_grid = get_of_horizontalwave(H, W, 10, 0.1)

fisheye_output = F.grid_sample(imgs, fisheye_grid, align_corners=True)
hwave_output = F.grid_sample(imgs, hwave_grid, align_corners=True)
plot(img, fisheye_output, hwave_output)
总结
本文介绍了两种用于增强图像数据的非线性增强方法,即鱼眼和水平波变换。鱼眼是一种非线性变换,它根据与固定中心像素的欧氏距离对像素进行变换。水平波变换是另一种非线性变换,它将像素扭曲成水平余弦波的形状。
- 分享
- 举报
 微信扫码分享
 QQ好友
QQ好友
 暂无数据
暂无数据-
浏览量:5792次2021-03-13 17:09:17
-
浏览量:3293次2020-08-14 18:40:18
-
浏览量:5621次2022-05-27 15:56:26
-
浏览量:13912次2021-05-12 12:35:30
-
浏览量:2818次2023-12-20 17:28:51
-
浏览量:7723次2020-10-09 14:28:11
-
浏览量:12442次2021-07-13 16:37:15
-
浏览量:4632次2020-08-05 20:32:31
-
2023-01-13 11:35:13
-
浏览量:6010次2019-12-28 10:17:47
-
浏览量:1912次2023-09-08 14:00:44
-
浏览量:4521次2024-02-04 17:13:47
-
浏览量:4956次2018-05-25 21:45:17
-
浏览量:2394次2021-12-17 17:19:43
-
浏览量:1771次2023-02-28 08:57:48
-
浏览量:3625次2020-12-12 11:04:14
-
浏览量:1990次2024-03-01 16:56:38
-
浏览量:1220次2023-12-19 11:06:03
-
浏览量:1156次2023-09-11 18:04:33

不会编程的老王
暂无个性签名~


-
6篇
- 【深度学习】基于Torch的Python开源机器学习库PyTorch概述
- 时间序列去趋势化和傅里叶变换
- 海思 AI 芯片 (Hi3559A V100) 算法开发(二) PC 仿真运行
- 使用yolo3实现图片中的数字检测与识别(四):数据集标注信息读取
- AscendCL快速入门——内存管理篇
- 新的LiGO技术加速了大型机器学习模型的训练
- 7. 在 Python OpenCV 寻找目标区域以及边缘扩展的解决方案
- 在Python中探索图像相似性方法
- AscendCL快速入门——运行资源管理篇(上)
- 图像处理合集:图像基础操作(图像翻转、图像锐化、图像平滑等)、图像阈值分割(边缘检测、迭代法、OSTU、区域增长法等)、图像特征提取(图像分割、灰度共生矩阵、PCA图像压缩)
-
广告/SPAM
-
恶意灌水
-
违规内容
-
文不对题
-
重复发帖
不会编程的老王

 微信支付
微信支付
举报类型
- 内容涉黄/赌/毒
- 内容侵权/抄袭
- 政治相关
- 涉嫌广告
- 侮辱谩骂
- 其他
详细说明
审核成功
审核失败


关注公众号
社区问题咨询:Ebaina-CN
定制需求咨询:xxqk158820